Malaria in Kenya
Malaria risk
Kenya has four malaria epidemiological zones:
- endemic
- seasonal transmission
- epidemic prone areas
- low-risk.
The zones vary in risk according to altitude, rainfall, temperature and humidity.
Kenya National Strategic Plan 2009 – 2017
A malaria-free Kenya is the ultimate vision of the national strategy. The goal of this strategy is by 2017 to reduce mortality caused by malaria in the various epidemiological zones by two thirds of the 2007/8 levels.
Bednet coverage
- 29% of total household population slept under an long-lasting insecticidal net (LLIN) in 2010 increasing to 48% in 2015 (Kenya Malaria Indicator Survey [KMIS] 2015)
- 63% of households owned at least one LLIN and 37% owned more than one in 2015 (KMIS 2015)
- 40% of households in Kenya have reached universal coverage (at least one LLIN for every two persons).
LINK activities
Making data available
The Kenya National Malaria Control Programme (NMCP) and the Kenya Medical Research Institute (KEMRI) - Wellcome Trust Research Programme have worked on mapping malaria risks in Kenya since 2009. In 2012 as part of Phase 1 of the LINK work undertaken by INFORM, the first comprehensive malaria epidemiological and control profile was developed and used to stratify counties into different levels of malaria endemicity. This sub-national profile has been the basis of malaria control planning since the devolution of health service delivery in 2013.
Under Phase 2 (2016), the KEMRI-Wellcome Trust programme as part of LINK has continued to work with the NMCP to update information on malaria prevalence nationwide through school surveys, providing technical support during the KMIS 2015 and assembling evidence from various research groups across the country. Data used for this second round of mapping consisted of 4,862 surveys in 3,684 unique locations. This assembly of survey data represents one of the largest of any country in Africa.
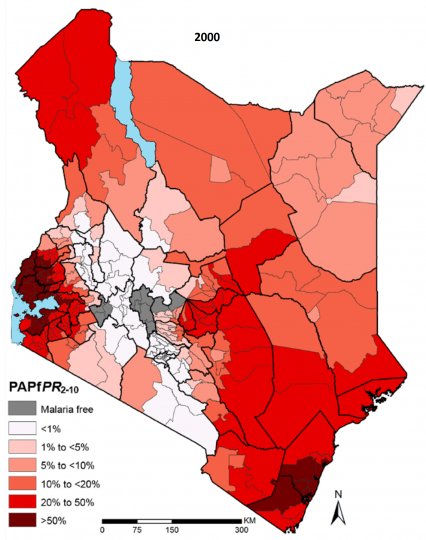
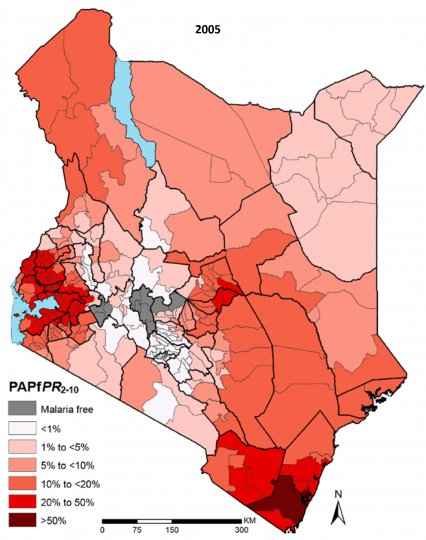
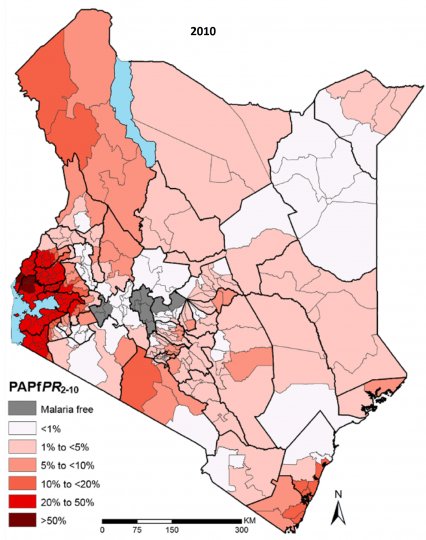
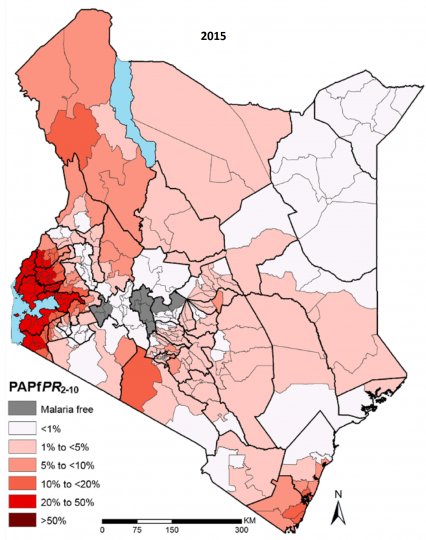
As a result of all this successful collaboration LINK produced a national epidemiology and control profile of malaria and 42 county-level risk maps in 2016. In addition, risk maps were generated for 2000, 2005, 2010 and 2015 which allowed for a comparison of P. falciparum parasite prevalence over time. The profile was reprinted in 2017.
As part of Phase 2 LINK has collated evidence from 1532 published articles or MSc/PhD theses and 63 implementation reports/policies.
Development of malaria control timeline
A timeline of the history of malaria control in Kenya was produced with the help of the NMCP in 2016-7. The history of malaria dates back to 1910 when larval control was started and quinine was first introduced as prophylaxis to 2016 when an insecticide management strategy was developed through to 2018. In all, the timeline covers over 100 major events in malaria control specifically looking at the areas of policy, vector control, intermittent preventative treatment, case management, surveillance, operational research and monitoring. The NMCP received the final timeline in January 2017.
Estimating malaria risk over space and time
From a 2000 baseline, the estimated P. falciparum malaria infection prevalence PfPR2-10 has reduced substantially. In 2000, 13.2% of Kenya’s population lived in areas where PfPR2-10 was >50% and by 2015, on average, there were no areas of hyper or holoendemic transmission (>50%PfPR2-10). In contrast, population in areas of PfPR2-10 was <1% or malaria free increased from 35.1% in 2000 to 53.6% in 2015. Malaria-free areas were defined on the basis of temperature limits and therefore the proportion of population in this zone remained constant throughout. The largest absolute reductions in transmission were observed in the Lake endemic and Coastal regions, where malaria was naturally highest and where most intervention efforts were concentrated. Despite these reductions, some of the gains made were undercut by the rapid increase in population. In addition, there were pockets within some counties where transmission increased.
Equally important is that most of the reductions in transmission in the hyper- and holoendemic areas appear to be in the period 2000-5, suggesting a natural transition from peak transmission, although major gains were also made across the board between 2005-10. The pace of reduction seems lower in the period 2010-5, where declines in transmission were mainly in the Lake endemic zone. For more details about county changes reference should be made to the county profiles.
Geo-coded health facility data
A key addition to the Phase 2 work was the collation, validation and final availability of a nearly complete geo-coded dataset of public health facilities throughout Kenya. The resulting dataset contains details of 7,087 (98%) geo-coded health facilities, by facility level i.e. hospitals, health centres and dispensaries.
Malaria intervention data
The following malaria intervention data were collated, estimated or mapped and included in the epidemiological profile:
Vector control
- ITN/LLIN distribution between 2004 – 2015 by sub-county
- coverage and use of ITNs by sub-county in 2003, 2007, 2008/9, 2010 and 2014/15
- percentage of households with universal ITN coverage (≤2 persons per ITN) by county and survey year
- percentage household population sleeping under an ITN the night before the survey by county and survey year
- counties where indoor spraying was targeted since 2005.
Malaria in pregnancy
- percentage of currently pregnant women who slept under an ITN the night prior to the survey by county and survey year
- percentage of women who received at least two doses of IPTp during a pregnancy within the last two years.
Malaria case management
- percentage of children under age five years with fever in the two weeks prior to the survey who sought treatment at an appropriate source by county and survey year
- percentage of fevers among children aged under five years treated with the recommended first line antimalarial drug among those treated for malaria by county and survey year.


