Malaria in Uganda
Malaria risk
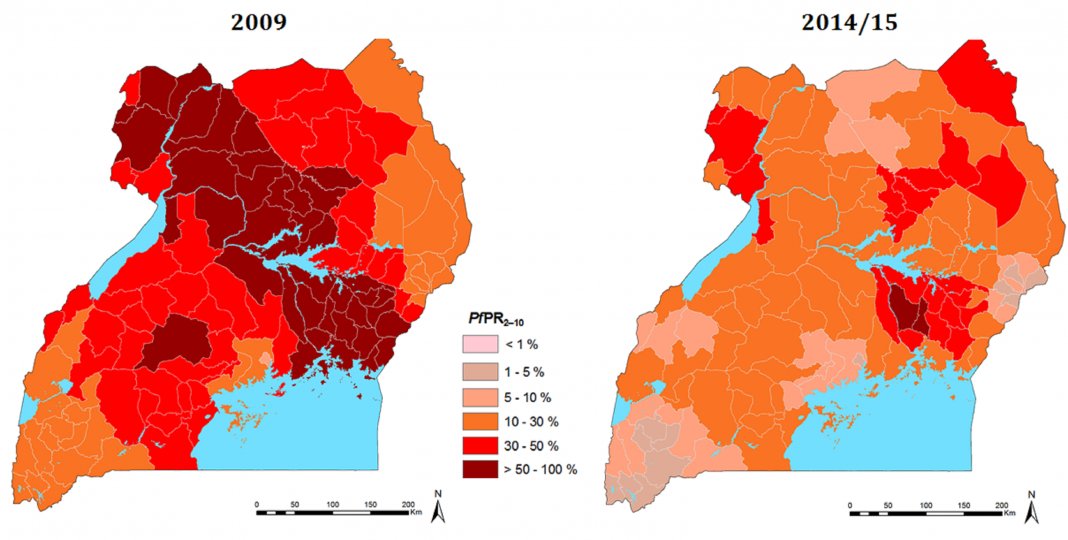
Uganda is one of the highest transmission countries for malaria in sub-Saharan Africa. As of 2010, the mean Plasmodium falciparum parasite rate in the 2-10 years age group (PfPR2-10) was 66%, a drop from 72% in 2000. In 2010, 72.3% of the Ugandan population lived in areas predicted to support hyper-holoendemic transmission (mean PfPR2-10 ≥50%).
Malaria Reduction Strategic Plan 2014 -20
The aim of the Malaria Reduction Strategic Plan (MRSP) 2014 -20 was: “Accelerated nationwide scale up to achieve universal coverage of cost effective malaria prevention and treatment interventions”.
The vision of the Ugandan Ministry of Health and National Malaria Control Programme (NMCP) is to have a “malaria free Uganda” with the initial goals of reducing the following by 2020:
- Annual malaria deaths from the 2013 level to near zero (i.e. 1 death per 100,000)
- Malaria morbidity to 30 cases per 1000 population
- Malaria parasite prevalence to less than 7% (i.e. over 85% reduction from a baseline of 45% in 2010).
Politically, the will to fight malaria is reflected in the ruling National Resistance Movement’s party manifesto (2010-6) to “totally eliminate malaria from Uganda through preventive methods”. The Minister of Finance, Planning and Economic Development in the budget framework paper of 2013/14, expressed the need to prioritise malaria on Uganda’s development agenda and subsequently called for the formulation of a comprehensive malaria reduction strategic plan. Estimated total funding needed for the MRSP is USD 1.361 billion over the six-year period.
Bednet coverage
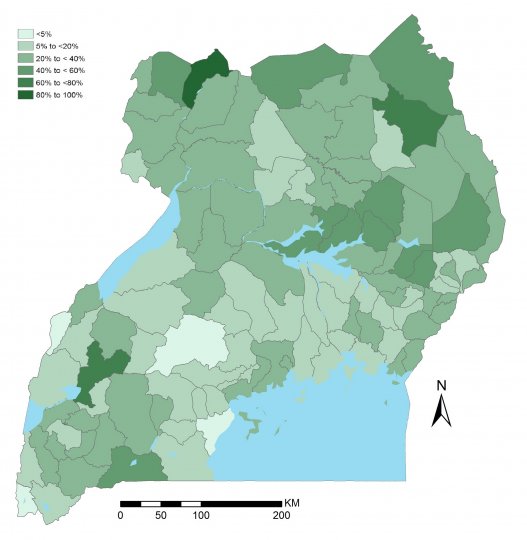
Insecticide Treated Nets/Long Lasting Insecticidal Nets (ITN/LLIN) coverage in Uganda has increased substantially since 2006 when households with at least one mosquito net for every two people ranged from <5% to <40%. As of 2014/2015 this indicator increased in range from <20% to >80% with a large proportion of districts estimated to have 60 – 79% of households with at least one net per two people.
Estimating malaria risk over space and time
Between 2000 and 2010, there has been a significant overall reduction in the proportion of Uganda’s living in holoendemic areas of Uganda.
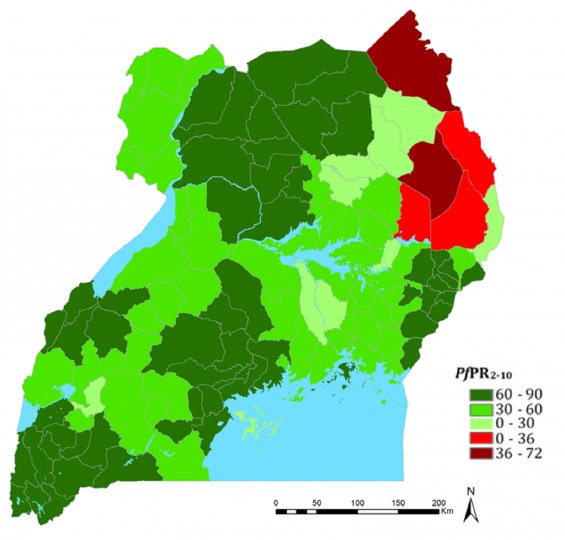
Less than 4% of the population live in areas that are essentially free of malaria. For Uganda, the mean PAPfPR2-10 in 2000 was 72%, by 2010 the corresponding mean was 66%, suggesting a drop in the levels of transmission intensity over the ten year interval. In 2000, 84.6% of the Ugandan population lived in areas predicted to support hyper-holoendemic transmission (mean PfPR2-10 ≥50%), by 2010, this had reduced to 72.3%. In 2000, 70% of Ugandan’s lived in areas of holoendemic transmission (mean PfPR2-10 ≥75%) but this had been substantially reduced to 46% of Ugandan’s living under these conditions by 2010.
This pattern was not universal, 25 districts achieved a greater than 20% reduction in mean PAPfPR2-10, by 2010 compared to model predicted values in 2000. The greatest reductions (≥50%) were recorded in Mitooma, Nsiika, Ntungamo, Rukungiri and Kampala. Over the same time period, 10 districts showed greater than 10% increase in transmission.
LINK activities
Making data available
In 2013, during Phase 1 of the project , data was systematically collated and compiled from online electronic databases and unpublished archived survey reports. The majority of these estimates were provided as raw, unpublished data linked to reports, thesis, peer-reviewed publications or conference abstracts. As part of this phase the first comprehensive malaria epidemiological and control profile was developed.
During Phase 2 meetings were held in Uganda to re-introduce the project, establish engagement and collect data. A malaria timeline and indicator poster were developed and the epidemiological profile was updated with the latest national survey data. The final dissemination took place in June 2018.
As part of Phase 2, LINK collated evidence from 285 published articles or MSc/PhD theses and 50 implementation reports/policies.


_0.jpg@itok=68m-mqOH)
.jpg@itok=-Z5FLPz8)

.jpg@itok=wsoR8XUX)