Malaria in Malawi
Malaria in Malawi is broadly characterised by intense malaria transmission, however, there is considerable local diversity of transmission intensity.
LINK activities
Engagement with decision-makers
During 2014 in Phase 1, an Epidemiological Profile of Malaria and its Control in Malawi was produced as a result of a collaboration between the Malaria Alert Centre, University of Malawi College of Medicine and INFORM, KEMRI Wellcome Trust with feedback and contributions from the National Malaria Programme (NMCP) and World Health Organization Regional Office for Africa. National scientists and international collaborators were approached and provided unpublished data. During this phase, LINK collated evidence from 134 published articles or MSc/PhD theses and 94 implementation reports/policies.
In 2018, LINK worked with the NMCP and Malawi-Liverpool Wellcome Trust Research Programme on Phase 2 of the project and attended the Annual malaria programme review in February 2018. An updated profile, indicator poster and timeline were produced and the final dissemination meeting took place on 17 September 2018.
Making data available
During the first phase, data was systematically collated and compiled from online electronic databases and unpublished archived survey reports. Through this we identified 921 estimates of malaria parasite infection at 886 unique locations between 1986 – 2012. The majority of these estimates were provided as raw, unpublished data linked to reports, thesis, peer-reviewed publications or conference abstracts.
Estimating malaria risk over space
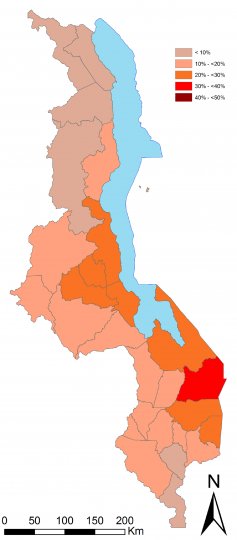
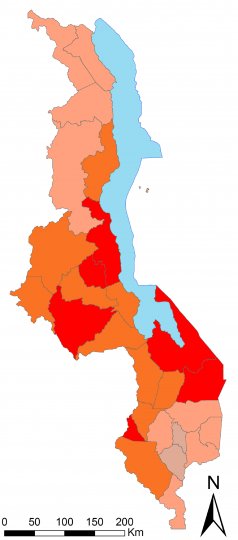
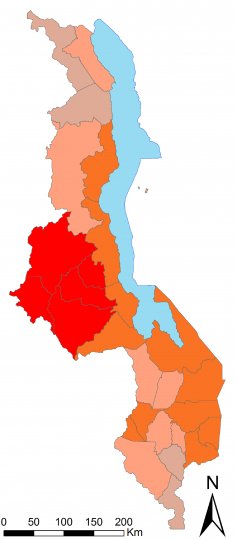
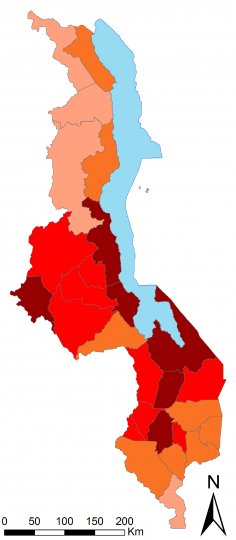
Predictions for 2000 and 2010 show that the transmission intensity of Plasmodium falciparum is largely mesoendemic or higher (PfPR2-10 ≥50%) across the country with some important variance within this range. The intensity of P. falciparum transmission appears not to have changed significantly despite a decade's investment in transmission control and remains very similar to patterns of malaria risk described since the 1930s. The mean population weighted childhood parasite prevalence (PfPR2-10) across Malawi in 2000 was 38% and in 2010 it was 43%.
In 2010, we predicted that 28% of the population, was living in areas where the PfPR2-10 was 50% or greater compared to 17% in 2000. The most intense transmission conditions are along Lake Malawi in the Central and Southern regions. Few districts have realised a reduction in malaria risk during the 2000-10 interval. The lack of any substantial reduction in parasite exposure over the decade 2000-10 is supported by an examination of hospital admission data and less perfect routine Health Management Information System (HMIS) data.
Geo-coded health facility data
Of 561 public health facilities, 97% were geo-located while 3% facilities remained un-positioned. The final dataset contains location of geo-coded facilities for 77 hospitals, 387 health and 81 health posts.
Malaria intervention data
The following malaria intervention data were collated, estimated or mapped and included in the epidemiological profile:
Vector control
- mean ITN coverage predictions in Malawi for 2000, 2004, 2006 and 2010
- location of IRS sites.


